import matplotlib.pyplot as plt

factory_default_figsize = plt.rcParams['figure.figsize']
print("Factory setting for figsize:", factory_default_figsize)
Factory setting for figsize: [6.4, 4.8]I often use matplotlib’s pyplot for quick plots while I’m trying things out in Jupyter Notebooks. I’m rarely ever happy with the default size of the plots and it gets annoying to change it manually for every single plot. Luckily, there’s an easy way to change this on a per document basis.
Assuming that pyplot is imported as plt, the default figure size is store in a dictionary entry plt.rcParams['figure.figsize']. Changing its value sets the default figure size for the current document.
import matplotlib.pyplot as plt
factory_default_figsize = plt.rcParams['figure.figsize']
print("Factory setting for figsize:", factory_default_figsize)Factory setting for figsize: [6.4, 4.8]## Example 1: Factory default figsize
import numpy as np
x = np.linspace(0,10,1000)
y = np.sin(x**2)
plt.plot(x, y)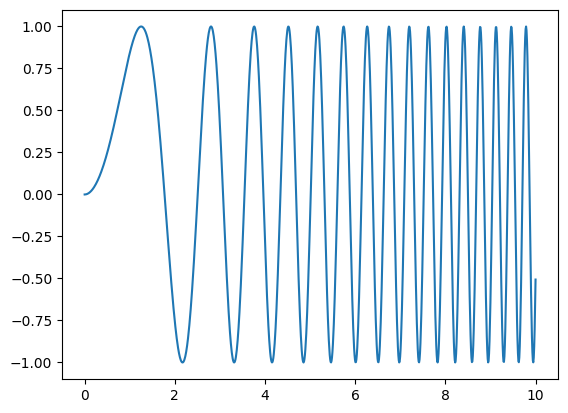
##  Example 2: Custom default figsize
import numpy as np
import matplotlib.pyplot as plt

# set a custom default figsize
custom_default_figsize = (15,5)
plt.rcParams['figure.figsize'] = custom_default_figsize

x = np.linspace(0,10,1000)
y = np.sin(x**2)

plt.plot(x, y)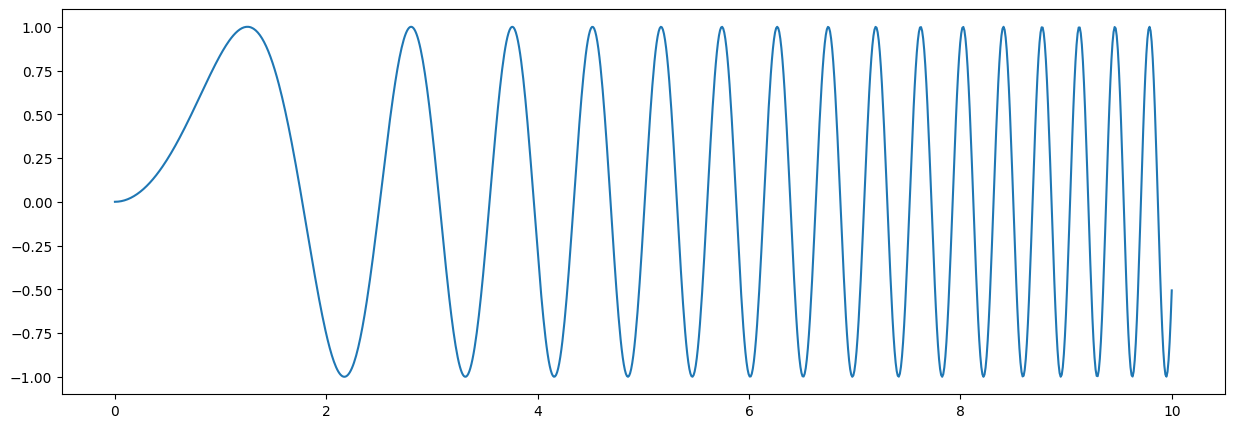
Lastly, it is worth mentioning that the dictionary plt.rcParams contains many other pyplot default setting (if not all of them). As I understand it, it is populated with the factory defaults everytime pyplot is being imported. Importantly, changing plt.rcParams['figure.figsize'] does not overwrite the factory settings! They are safely stored somewhere else. So doing this in one document does not affect any other.